I have taken the same behavioural assessment four times across seventeen years. Here is what moved, what didn’t, and what that tells you about your own report.
Have you ever done a behavioural assessment? Most people have by now. They turn up in onboarding, in leadership programmes, in the away day nobody wanted to go on.
And most people have the same experience. You get a report, you read the bit about yourself, you say “that’s uncanny” or “that’s rubbish”, and then it goes in a drawer.
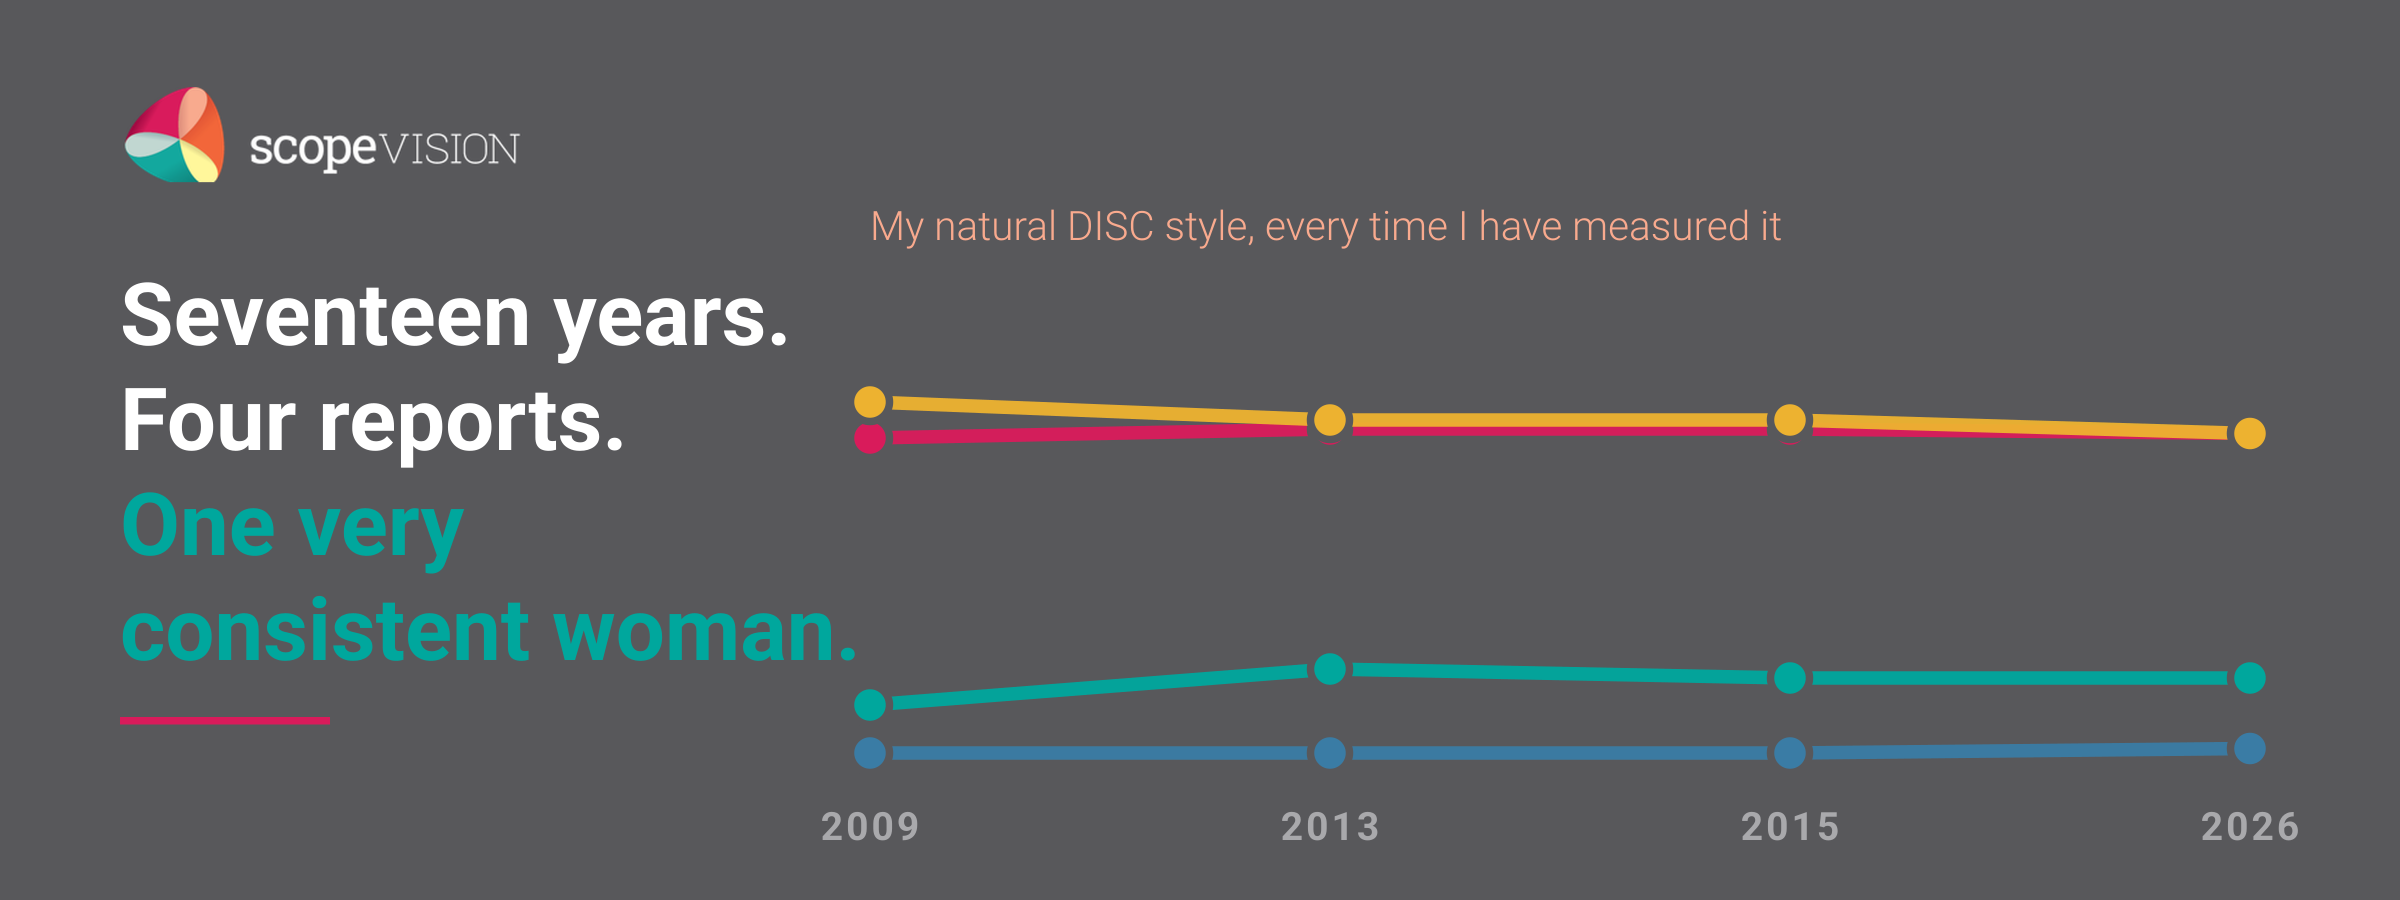
I want to do something different with mine. I have sat the same instrument in 2009, 2013, 2015 and again in August 2026. Four reports, seventeen years, one person. I have never seen a practitioner publish that, so I am publishing mine.
Most of it is reassuring. One number in it is not, and I have been quietly managing that number for seventeen years without ever writing it down. It is at the bottom of this article.
First, the man who started it
I have long been a DISC fanatic. The framework was fashioned by Dr William Moulton Marston, a Harvard-educated lawyer with a doctorate in psychology, and he is the reason this article has the title it does.
Marston pioneered the systolic blood pressure test that became part of the polygraph. He also created the comic book character Wonder Woman, who fights crime with a lasso that compels people to tell the truth. A man who spent his career on truth-telling built one machine to detect it and one heroine to compel it. Somewhere in between, he wrote the book this whole framework rests on.
That book is Emotions of Normal People (1928), and in it he set out four patterns of behaviour a person is likely to show in response to the environment they find themselves in. His original four were Dominance, Inducement, Submission and Compliance. The modern version reads Dominance, Influence, Steadiness and Compliance, which is gentler on the ear and means much the same thing.
One thing worth knowing up front. Marston never built an assessment. He described the patterns. The instruments came later, from other people, and there are dozens of them. Which one you sat matters.
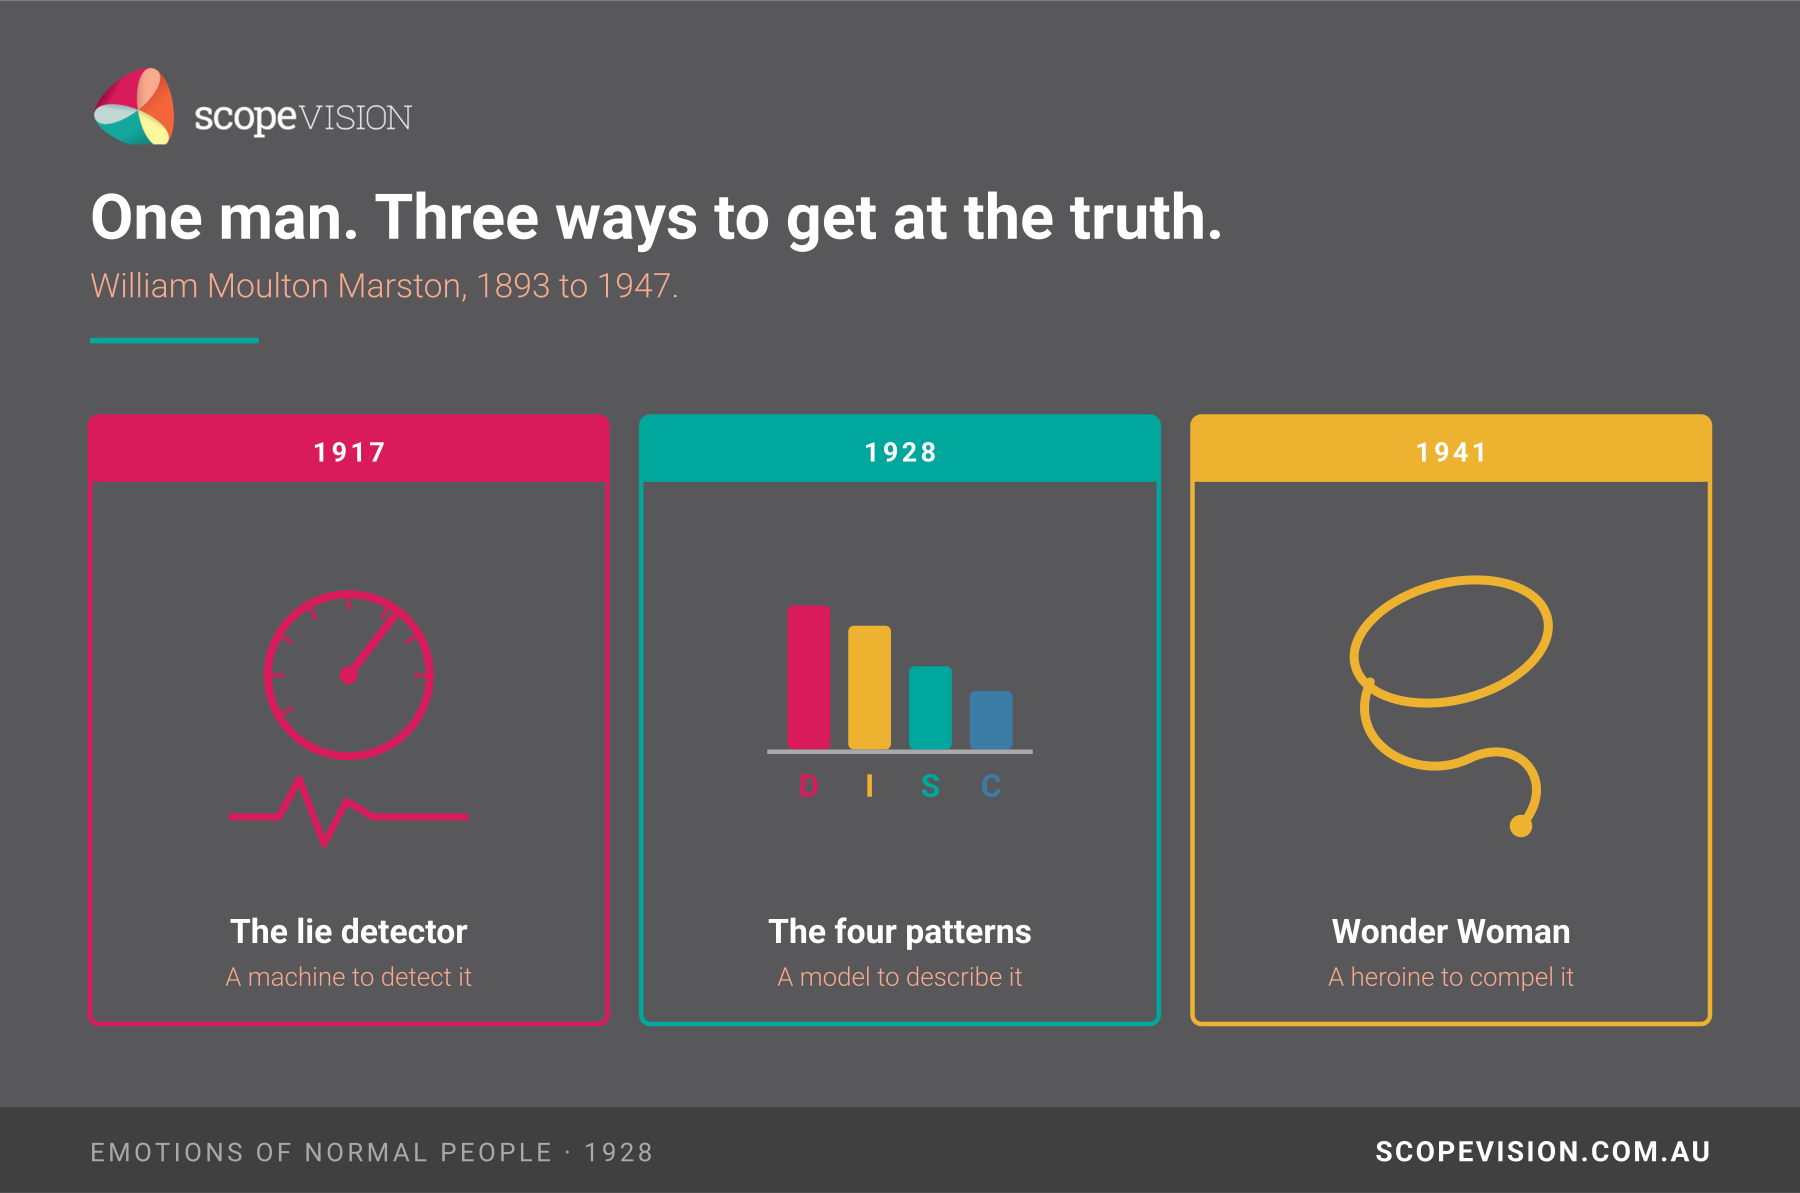
Figure 1. William Moulton Marston, 1893 to 1947.
The four letters
Each letter gives context to behaviour you can actually observe. Not what somebody is thinking, not what they intend. What you can see.
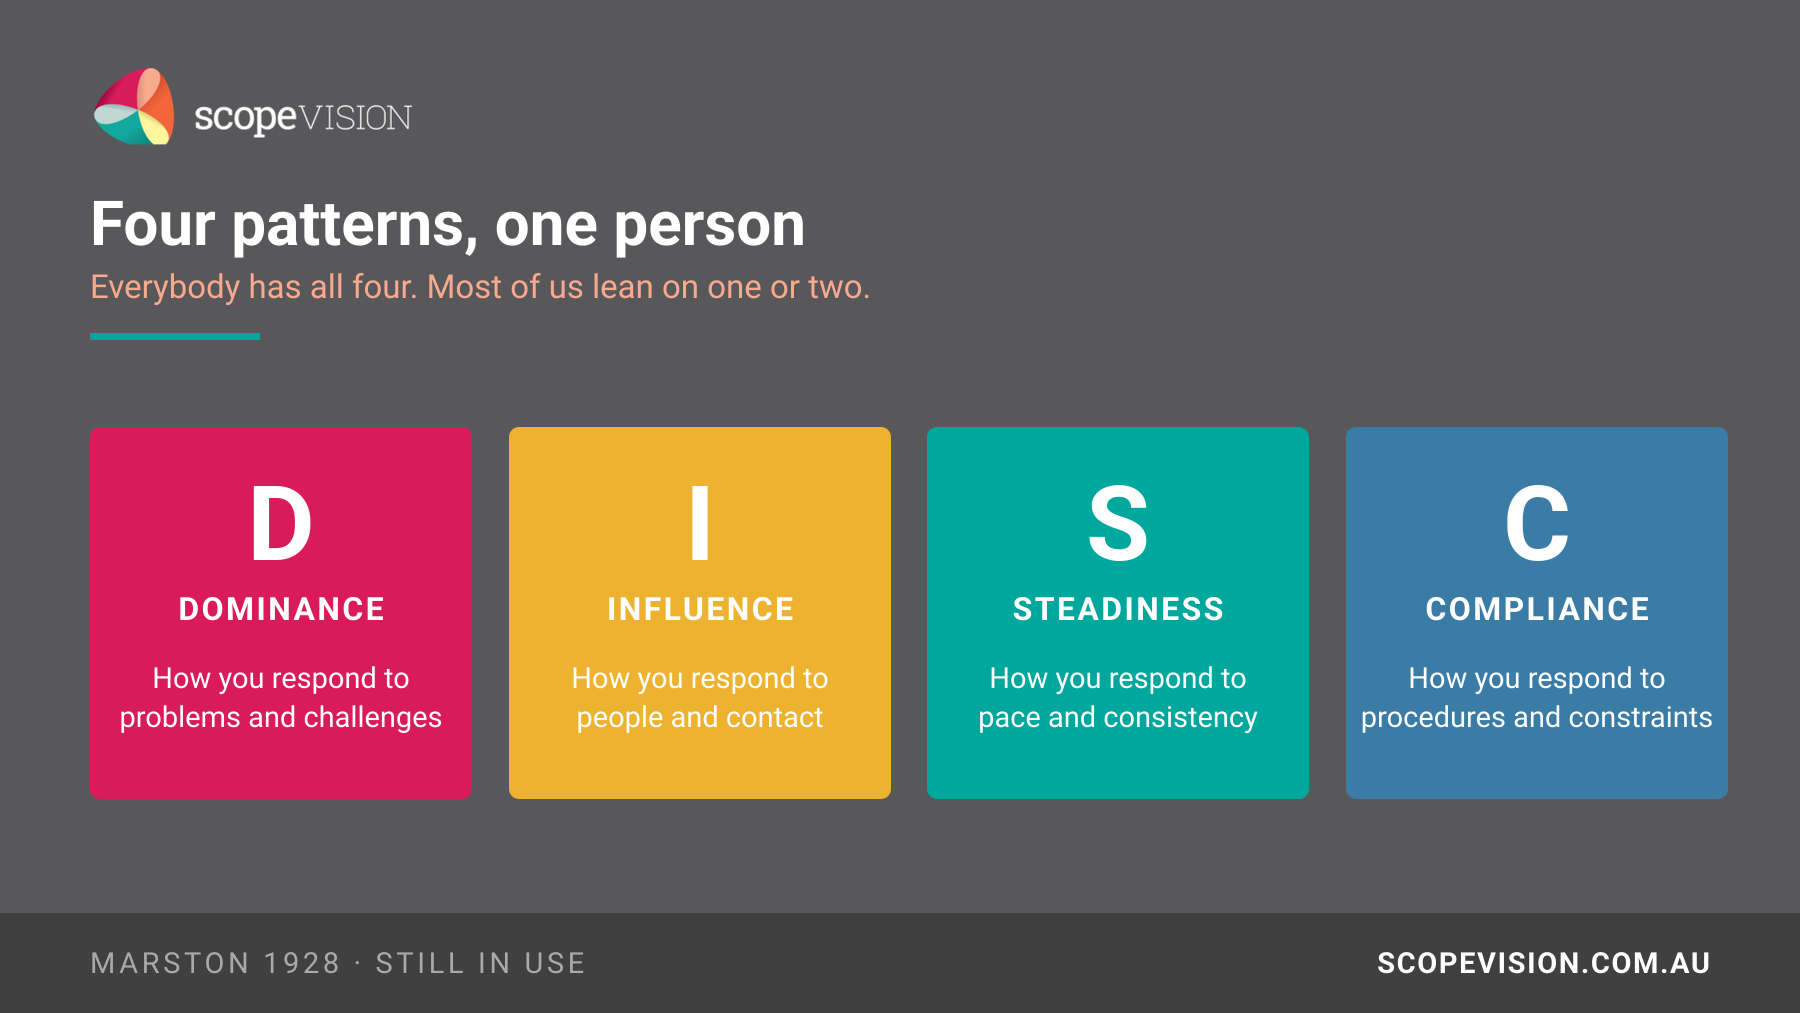
Figure 2. Four patterns, one person.
All four are present in everybody. From a young age most of us develop a preference for one or two over the others. You can consciously work against that preference, but DISC holds that doing so takes effort to sustain and that idea is the whole reason this article has anything interesting in it.
Natural and adapted: two graphs, not one
A Style Insights report gives you two graphs. Natural, and adapted.
The natural graph is how you wake up. It is the style you show with family, with old friends, at the end of a long week when you have stopped managing yourself. The adapted graph is how you modify that when you are engaging with others, usually at work. The distance between the two is the interesting part.
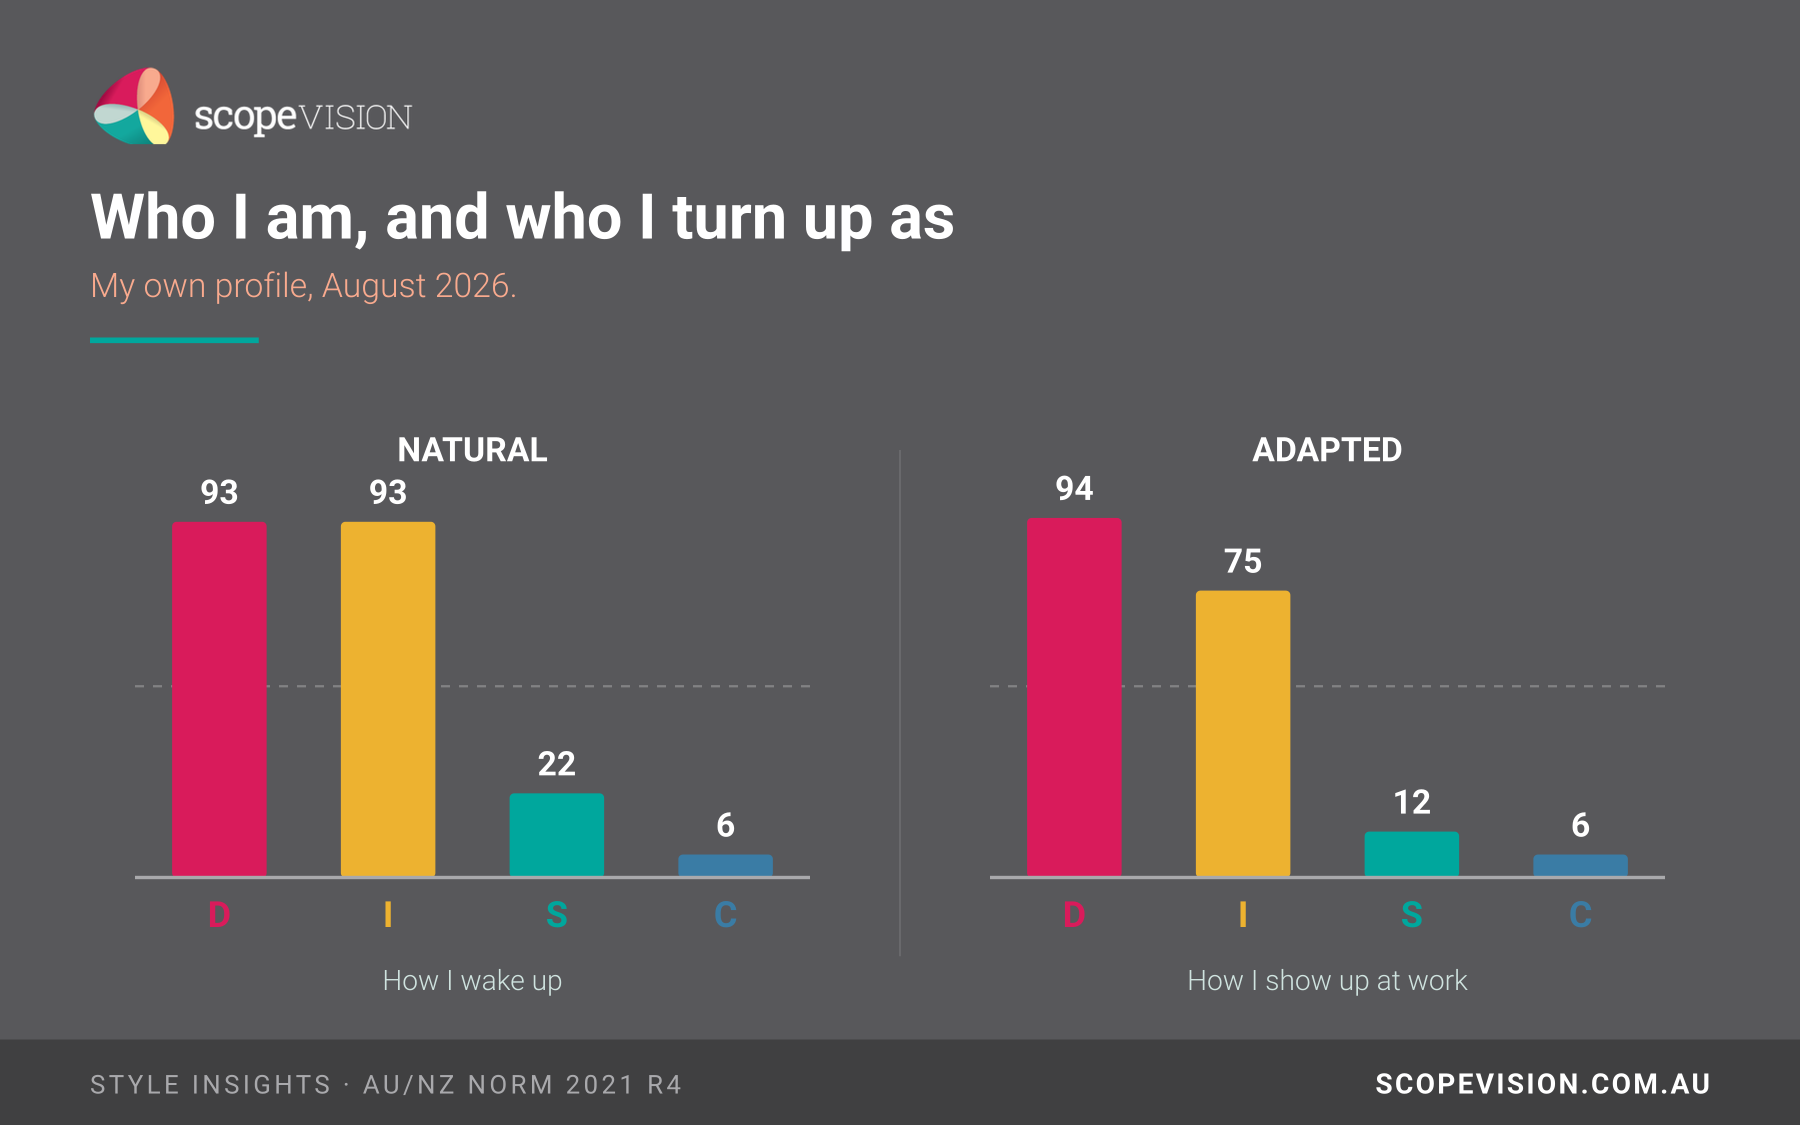
Figure 3. My own profile, August 2026.
Read mine. I wake up demanding and enthusiastic in roughly equal measure, with very little patience for slow processes and even less for rules I did not agree to. At work I hold the drive steady, pull the enthusiasm down by eighteen points, and shed ten of the very few points of patience I had to begin with.
That last part is the bit I would have denied for years.
Seventeen years of the same question
Here is where it gets useful. Every DISC session I have ever run produces the same question, usually within the first twenty minutes: does this change?
Practitioners have a stock answer. Natural style is fairly stable, adapted style moves with your circumstances. It is a confident answer and almost nobody backs it with data, because almost nobody has sat the same instrument across a working lifetime and kept the reports.
I have.
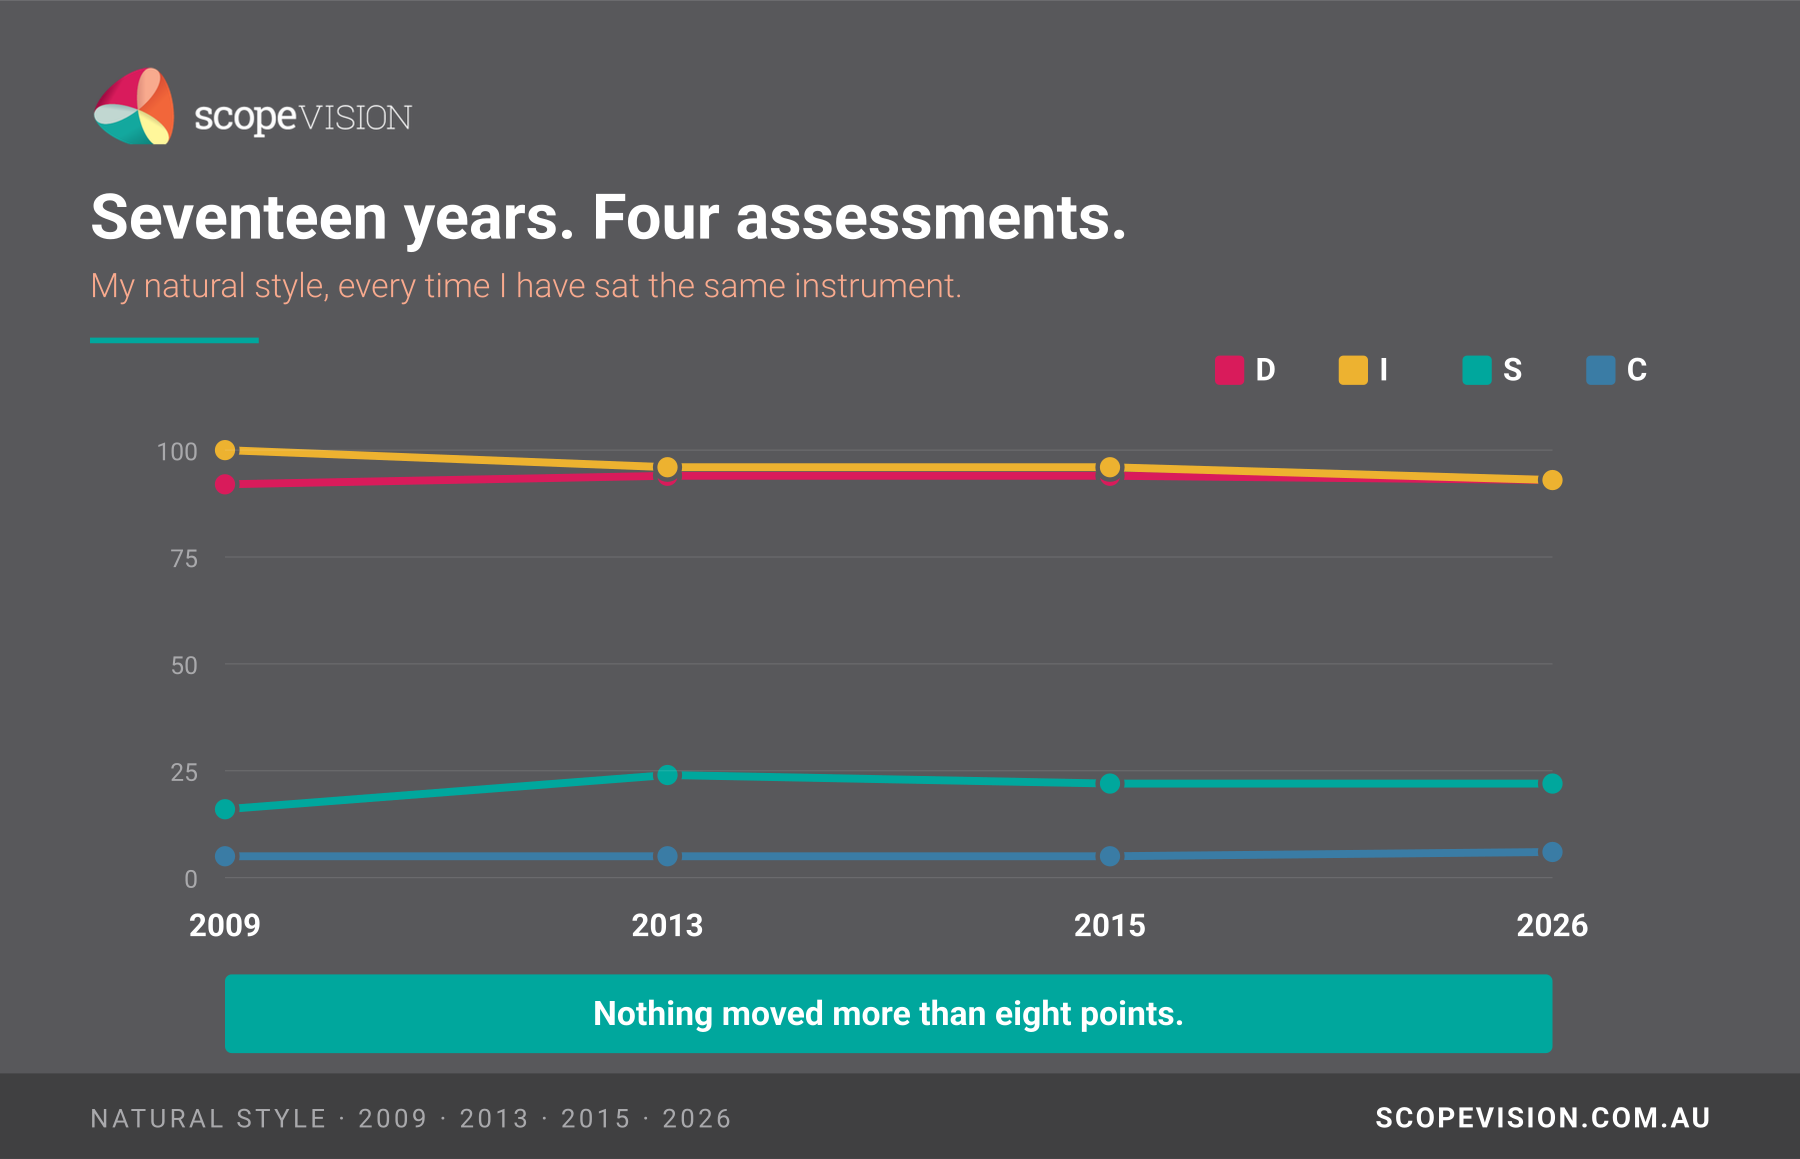
Figure 4. My natural style, four assessments, seventeen years.
| Natural style | D | I | S | C | Norm base |
| 2009 | 92 | 100 | 16 | 5 | 2003 |
| 2013 | 94 | 96 | 24 | 5 | 2012 R4 |
| 2015 | 94 | 96 | 22 | 5 | 2014 R4 |
| 2026 | 93 | 93 | 22 | 6 | 2021 R4 |
Seventeen years, all of them inside a business I founded in 2000, and everything else that happened around it. A diagnosis, a recession, a pandemic, clients won and clients lost, and every hard conversation in between. Nothing moved more than eight points.
D sat at 92, 94, 94, 93. C sat at 5, 5, 5, 6. Only one scale shows any consistent travel at all: my I has come down from 100 to 93, slowly, over seventeen years. In 2009 it was pinned at the ceiling, which means the instrument could not measure any higher and the real figure may well have been higher still.
The interesting one is S, which jumped eight points between 2009 and 2013 and then sat still. It is the largest single movement in the whole set, and I would love to tell you what it means. I can’t. That gap is also the biggest change of norm base in the series, 2003 to 2012 R4, and a score is only ever a position against whoever is in the reference group. So the eight points could be four years of my life, or it could be the yardstick being redrawn underneath me. There is no way to tell from the reports, and any practitioner who tells you otherwise is guessing.
So the practitioners are right, and now there is at least one person’s evidence for it. Natural style is durable. If you got a report you disagreed with, you will probably get the same one in a decade.
What actually changed
If the natural graph barely moves, the adapted graph is where a life shows up. Add the four gaps between natural and adapted, and you get a single number: how many points of yourself you were editing to get through a work day.
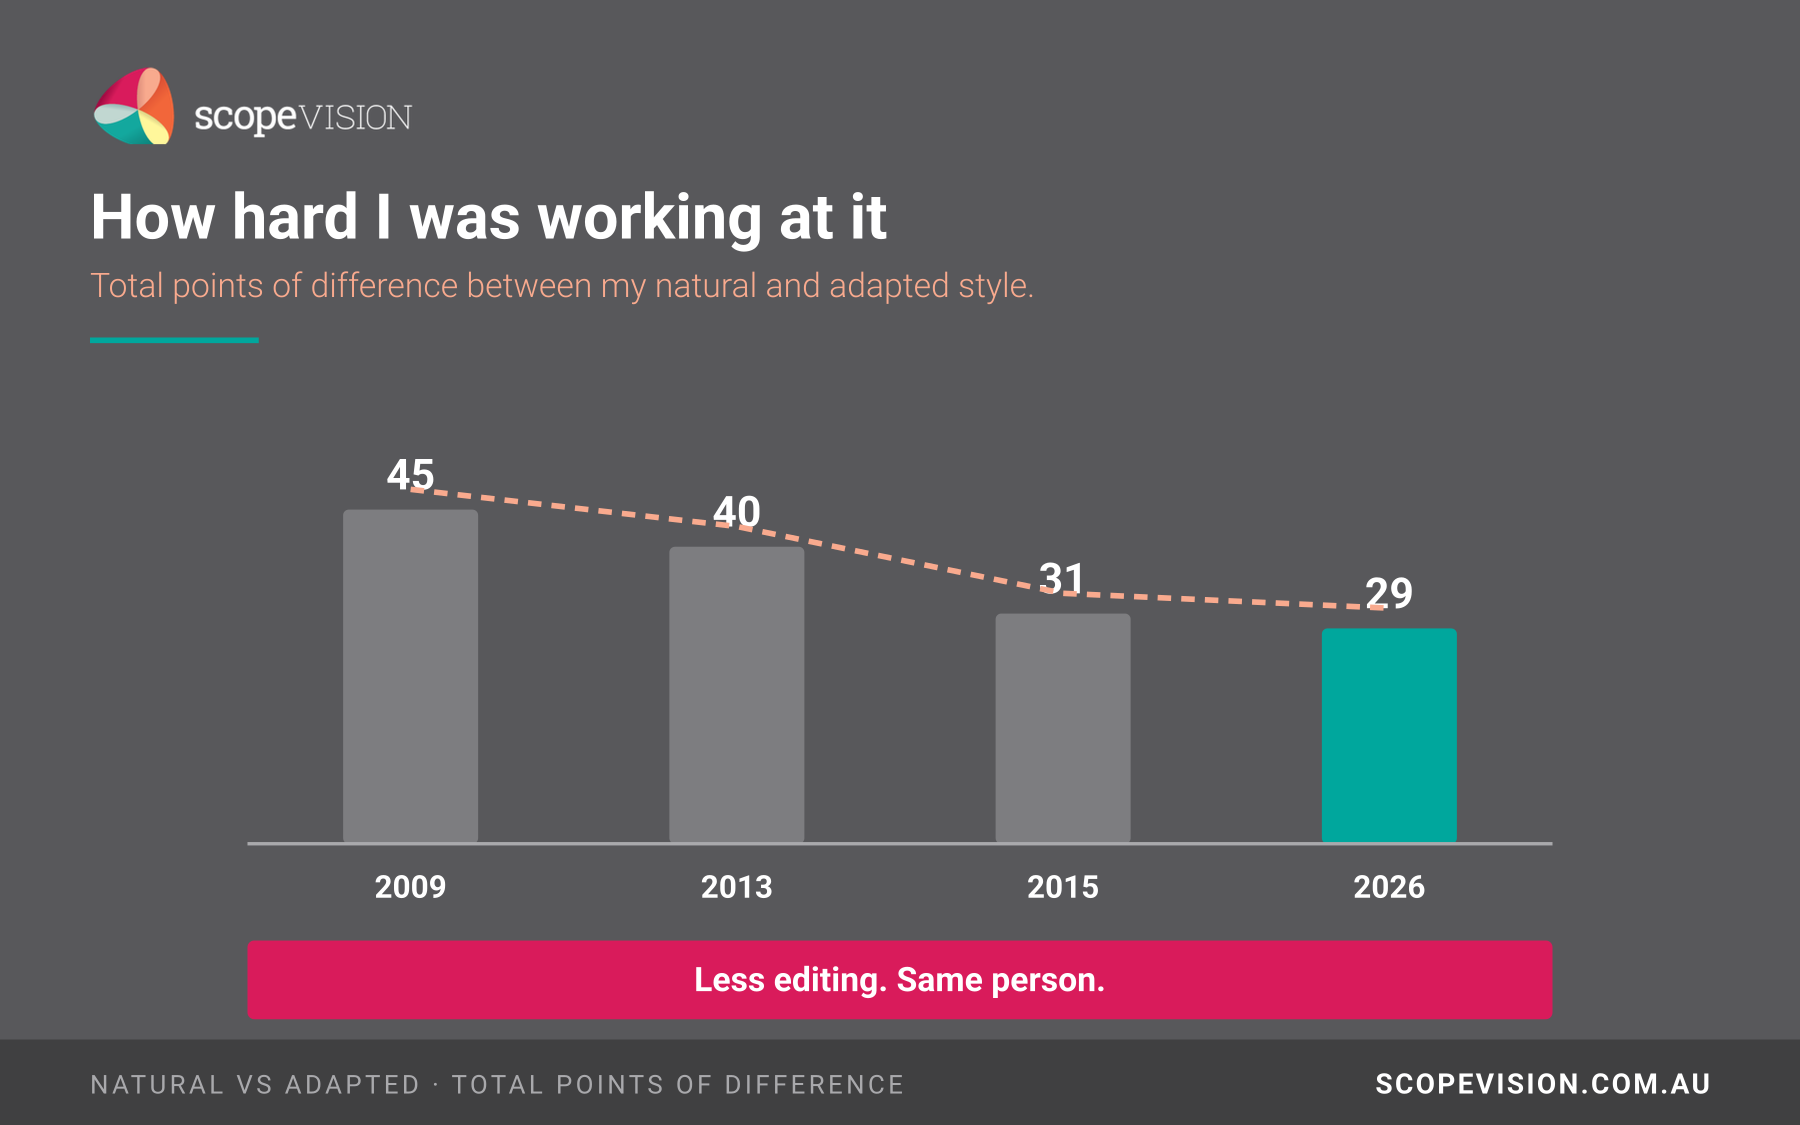
Figure 5. Total adaptation, 2009 to 2026.
Forty-five, forty, thirty-one, twenty-nine. A clean line down over seventeen years, and it is the most satisfying result in the set. Note what did not cause it. I have worked for myself since 1997, and as Scope Vision since 2000, so all four of these reports were taken from the same chair. There is no change of employer hiding in that line. Whatever brought it down happened inside the same business.
But the total hides the more interesting story, which is where the editing sits.
| Points suppressed | Influence | Steadiness |
| 2009 | 34 | 0 |
| 2013 | 18 | 20 |
| 2015 | 13 | 16 |
| 2026 | 18 | 10 |
In 2009 almost everything I was doing was turning myself down. Thirty-four points off my enthusiasm, and not a single point of pretending to be patient. I was a naturally exuberant person turning the dial down, and that was the whole of my professional adaptation.
By 2013 something had flipped. I was manufacturing twenty points of patience I did not have. And from there it falls: twenty, sixteen, ten. The enthusiasm suppression never really went away. The performed patience did.
So the performed patience has been falling away for a decade. Not because I am less impatient, but because I stopped hiding it and started telling people instead.
The enthusiasm is a different story, and it is the one number in this whole set I cannot explain with a graph.
The eighteen points I keep giving away
Every other line in this article is heading where I would want it to. Total adaptation falls. Performed patience falls. My natural style barely moves. And then there is my Influence suppression, which went thirty-four, eighteen, thirteen, and back up to eighteen.
It is the only gap that has not closed.
I know exactly what it is, and it has nothing to do with volume.
The hardest adaptation of my working life has not been learning to slow down or hold my tongue. It has been dialling down fun, positivity and humour to meet a room that has decided those things are unprofessional. Not unkind. Not inappropriate. Just not the approved culture in this workplace.
I have sat in a great many corporate rooms where the unspoken rule is that warmth reads as lack of gravity, and where the person making people laugh is assumed to be the person who has not read the papers. So I turn it down. Eighteen points of it, on average, every working day, for seventeen years.
I will be straight about my own end of this. My humour is fast, and fast humour sometimes gets ahead of me. That is a real thing to manage and I do manage it, because intent is not the same as impact and a leader does not get to argue with how something landed. But my intent has never been to demean anybody, and there is a difference between humour that punches at someone and humour that simply refuses to be solemn. Most workplaces do not distinguish between the two. They just quietly file both under risk.
So this is the honest version of an eighteen-point gap. Some of it is discipline, and that part is right and I would defend it. Some of it is a tax, paid in energy, for working in rooms that mistake seriousness for rigour.
I am not sure a report can tell you which is which. Mine certainly cannot. But it can tell you the gap is there, and it can tell you it has not moved in a decade, and that is the most useful thing a number has ever told me about myself.
If you want the conversation your team should be having about this, it is one of twenty in another article:
Align your team's vision, behaviour and consequences
What this proves, and what it doesn't
I am about to hand this to a room of leaders, so let me be honest about its limits before somebody else is.
One person is an illustration, not a study. Four data points from one woman tell you what happened to me. They cannot tell you what happens to people. If this were research it would need hundreds of participants and a control for age.
The scoring is ipsative. That is the technical word for a forced-choice format where you rank options against each other rather than rate each one independently. The consequence matters: my four scores are relative within me, not measured against a population. A D of 93 does not mean I am more dominant than 93 per cent of people. It means dominance ranks high among my own four.
The norm base changed three times. 2003, then 2012 R4, then 2014 R4, then 2021 R4. Scores are scaled against a reference group, and that group was re-drawn between each of my reports. Some of the small movement you can see in Figure 4 may be the yardstick shifting rather than me.
One thing that is not a caveat, and is worth saying plainly. All four reports were run
Where this comes from
The framework originates with Marston (1928). The instrument used for all four of my reports is the Style Insights assessment, developed from Marston's model by Bill Bonnstetter, who built the first computerised version in the 1980s. All four were administered by Scope Vision. I have held accreditation as a DISC practitioner throughout, originally through DTS International, whose Style Insights reports now carry the TTI Success Insights Ltd copyright. Same instrument, same practitioner, four norm bases.
On the limits of the format generally: DISC-type instruments are ipsative, and there is a long-running methodological debate about what can legitimately be compared between people on forced-choice scores. Nothing in this article compares me to anybody else, which is the only reason the charts are defensible. The tendency to accept a flattering general description as personally accurate is the Barnum or Forer effect, demonstrated by Forer (1949) and named by Meehl (1956). Worth knowing before you decide your report is uncanny.
My thanks to TTI Success Insights, publishers of the Style Insights assessment used for all four of these reports, for their time and care in reviewing this article before publication. The conclusions are my own.
References
Forer, B.R. (1949) 'The fallacy of personal validation: a classroom demonstration of gullibility', Journal of Abnormal and Social Psychology, 44(1), pp. 118-123.
Marston, W.M. (1928) Emotions of Normal People. London: Kegan Paul, Trench, Trubner and Co.
Meehl, P.E. (1956) 'Wanted, a good cookbook', American Psychologist, 11(6), pp. 263-272.
Cite this article
Satterthwaite, M-J. (2026) 'Seventeen Years, Four Reports, One Very Consistent Woman', Scope Blog, 22 August. Available at: https://scopevision.com.au/blog/what-do-wonder-woman-disc-have-in-common (Accessed: [insert date]).
In text: (Satterthwaite, 2026).
This article grew out of 'What Do Wonder Woman and DISC Have In Common?', published at this address in December 2016, which explained DISC using a single profile from 2015. The web address has been kept so that inbound links to the original still work. It is dated 2026 rather than cited as a revision because the evidence in it did not exist in 2016: the seventeen-year comparison rests on four assessments, the most recent sat in August 2026, alongside a statement of the method's limits.
Keep reading
- The Richmond Way. The four styles explained through Ted Lasso, if you want the model rather than the evidence.
- The 13 Counterfeits of Trust. What a style looks like when it runs under pressure with the situational read switched off.
- The Keys to Holding Great Coaching Conversations. Knowing someone's style is not the same as knowing which conversation to have with them.
Your own two graphs
Want to know what the distance between yours is costing you?
I am an accredited Style Insights practitioner and I run these for individuals and for whole teams. Not a letter and a handshake. A proper conversation about what your two graphs are telling you, and which of your adaptations are discipline and which are tax.
Email MJ about a debrief Use the contact form instead
The first button opens your email app with three questions already in it. If nothing happens when you tap it, your device has no mail app set up, so use the contact form.
Driving results through people is what we do.